Inverse Watch Docs
AppLanding
  • Overview
    • Home
    • Governance
      • Proposal 7
      • Proposal 25
      • Proposal 52
      • Proposal 107
      • Proposal 147 - S1
      • Proposal 189 - S2
  • Products
    • Inverse Alerts
      • See on Twitter
    • Inverse Chatbot
      • /doc
      • /imagine
      • /data
      • /graph
    • Inverse Subgraphs
      • See inverse-subgraph on Mainnet
      • See inverse-governance-subgraph on Mainnet
    • Inverse Watch
      • Go to App
  • User Guide
    • Quickstart
    • Alerts
      • Setting Up an Alert
      • Adding New Alert Destinations
      • Customize Alert Template
      • Multiple Column Alert
    • Queries
      • Creating and Editing Queries
      • Querying Existing Query Results
      • Query Parameters
      • How to Schedule a Query
      • Favorites & Tagging
      • Query Filters
      • How To Download / Export Query Results
      • Query Snippets
    • Visualizations
      • Cohort Visualizations
      • Visualizations How-To
      • Chart Visualizations
      • Formatting Numbers in Visualizations
      • How to Make a Pivot Table
      • Funnel Visualizations
      • Table Visualization Options
      • Visualizations Types
    • Dashboards
      • Creating and Editing Dashboards
      • Favorites & Tagging
      • Sharing and Embedding Dashboards
    • Data Sources
      • CSV & Excel Files
      • Google Sheets
      • JSON (API)
      • Python
      • EVM Chain Logs
      • EVM Chain State
      • GraphQL
      • Dune API
    • Machine Learning
      • Data Engineering
      • Regressors
        • Linear Regression
        • Random Forest
        • Ada Boosting
        • Gradient Boosting
        • Neural Network (LSTM)
      • Training and Predicting
      • Metrics & Overfitting
      • Examples
        • Price Prediction
          • Data Preprocessing
          • Model Creation & Training
          • Metrics Evaluation
          • Back Testing
          • Visualizing
        • Liquidation Risk
  • Admin & Dev Guide
    • Setup
    • Redash
    • Integrations & API
    • Query Runners
    • Users
      • Adding a Profile Picture
      • Authentication Options
      • Group Management
      • Inviting Users to Use Redash
      • Permissions & Groups
    • Visualizations
  • Cheat Sheets
    • Snippets
    • Contracts
  • More
    • Deprecated Apps
    • Github : inverse-flaskbot
    • Github : inverse-subgraph
    • Github : inverse-watch
Powered by GitBook
On this page
  • 1. Usage
  • 2. Limitations

Was this helpful?

  1. User Guide
  2. Queries

Query Filters

PreviousFavorites & TaggingNextHow To Download / Export Query Results

Last updated 1 year ago

Was this helpful?

Query Filters let you interactively reduce the amount of data shown in your visualizations, similar to Query Parameters but with a few key differences. Query Filters limit data after it has been loaded into your browser. This makes them ideal for smaller datasets and environments where query executions are time-consuming, rate-limited, or costly.

1. Usage

Unlike Query Parameters there isn’t a button to add a filter. Instead, if you want to focus on a specific value, just alias your column to <columnName>::filter. Here’s an example:

SELECT action AS "action::filter", COUNT(0) AS "actions count"
FROM events
GROUP BY action
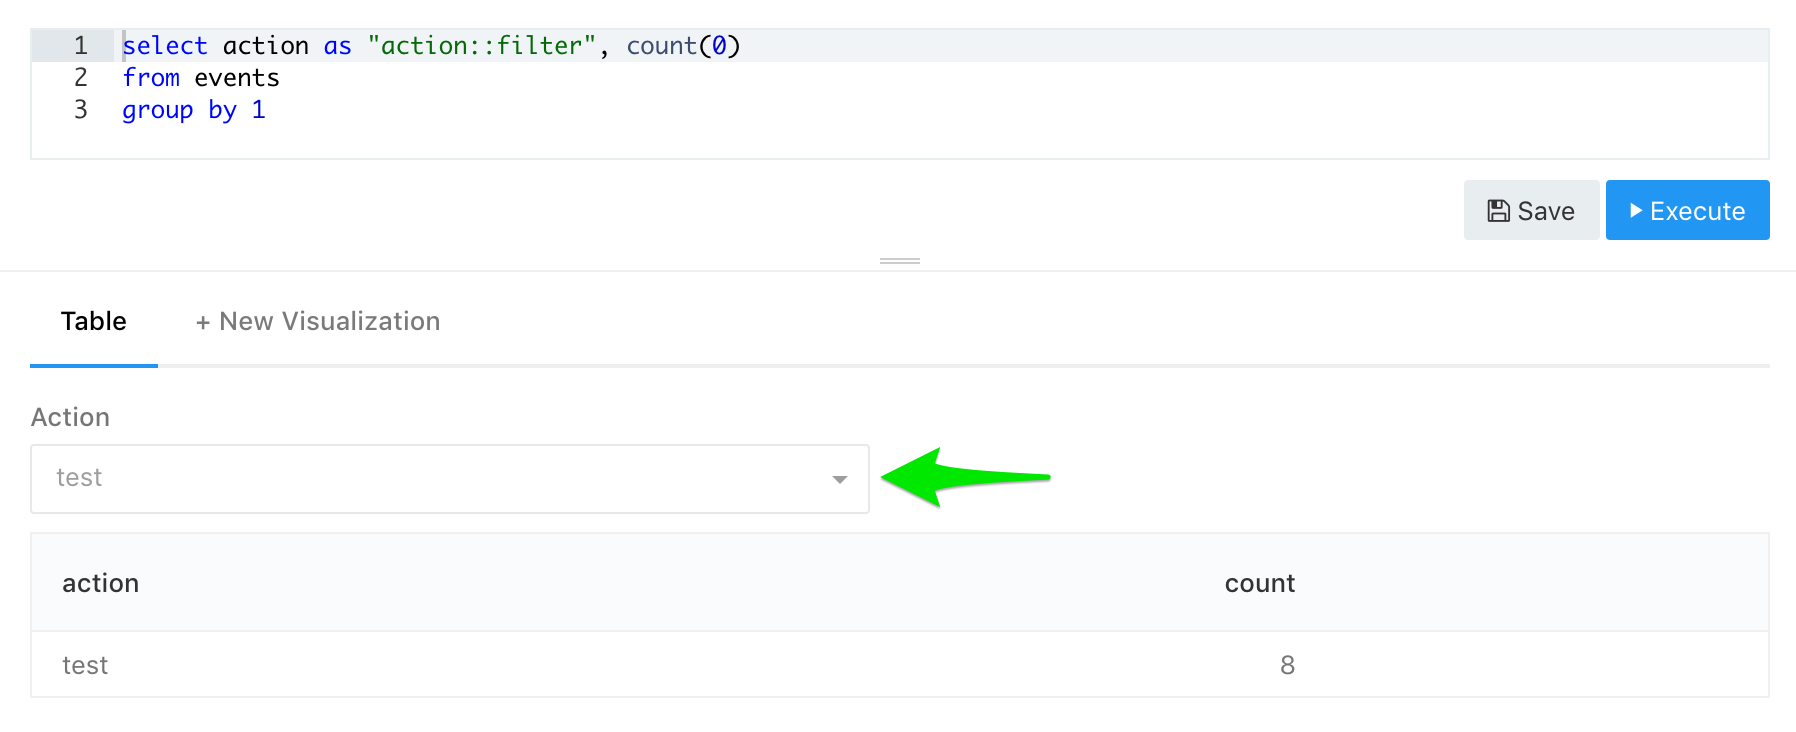
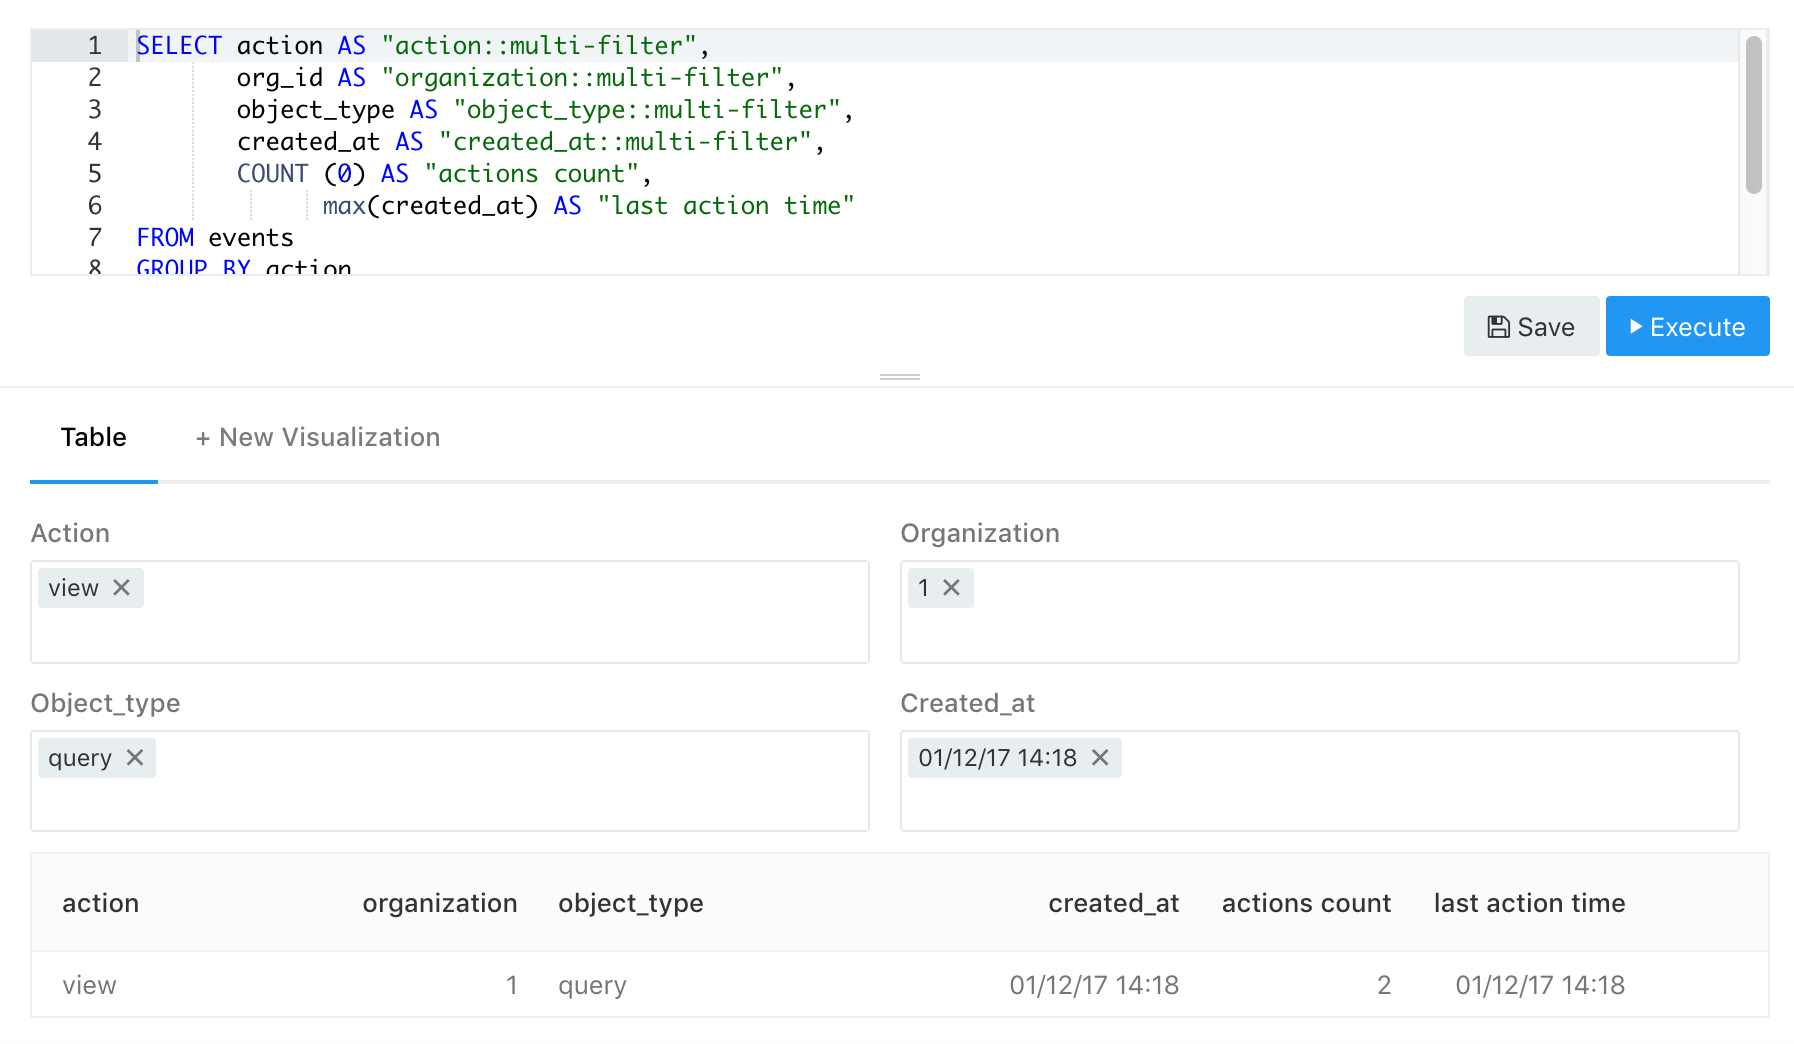
Note that you can use__filter or __multiFilter, (double underscore instead of double quotes) if your database doesn’t support :: in column names (such as BigQuery).

If you need a multi-select filter then alias your column to <columnName>::multi-filter.

SELECT action AS "action::multi-filter", COUNT (0) AS "actions count"
FROM events
GROUP BY action

2. Limitations

Query Filters aren’t suitable for especially large data sets or query results with hundreds or thousands of distinct field values. Depending on your computer and browser configuration, excessive data can deteriorate the user experience.

You can use Query Filters on dashboards too. By default, the filter widget will appear beside each visualization where the filter has been added to the query. If you’d like to link together the filter widgets into a dashboard-level Query Filter see .

these instructions