> For the complete documentation index, see [llms.txt](https://docs.inverse.watch/llms.txt). Markdown versions of documentation pages are available by appending `.md` to page URLs; this page is available as [Markdown](https://docs.inverse.watch/user-guide/alerts/setting-up-an-alert.md).
# Setting Up an Alert
The application alerts notify you when a field returned by a [Schedule a Query](https://docs.inverse.watch/user-guide/queries/how-to-schedule-a-query) meets a threshhold. Use them to monitor your business. Or integrate them with tools like Zapier or IFTTT to kickoff workflows such as user on-boarding or support tickets. Alerts complement scheduled queries, but their criteria are checked after every execution.
A query schedule is not required but is *highly recommended* for alerts. If you add an alert to a non-scheduled query you will be notified only if a user executes the query manually and the alert criteria are met.
{% hint style="warning" %}
A query schedule is not required but is *highly recommended* for alerts. If you add an alert to a non-scheduled query you will be notified only if a user executes the query manually and the alert criteria are met.
{% endhint %}
{% hint style="warning" %}
Alerts don’t work for queries with parameters.
{% endhint %}
To see a list of current Alerts, click **Alerts** on the navbar. By default, they are sorted in reverse chronological order by the **Created At** column. You can reorder the list by clicking the column headings.
* **Name** shows the string name of each alert. You can change this at any time.
* **Created By** shows the user that created this Alert.
* **State** shows whether the Alert status is `UNKNOWN`, `TRIGGERED`, or `OK`.
### 1. Usage
Click the **Create** button in the navbar and then click **New Alert**.
Search for a target query. If you don’t see the one you want, make sure it is published and does not use parameters.
Use the settings panel to configure your alert.
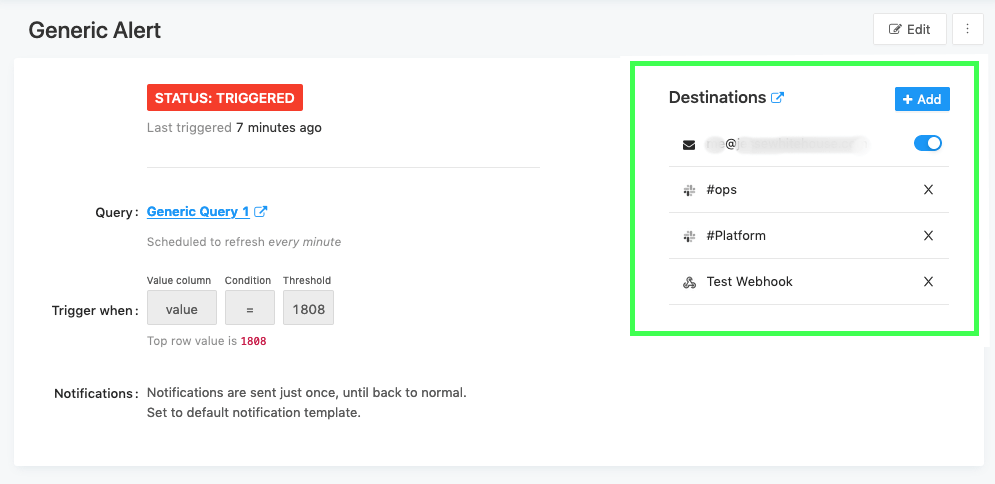
* The **Value column** dropdown controls which field of your query result will be evaluated.
* The **Condition** dropdown controls the logical operation to be applied.
* The **Threshold** text input will be compared against the *Value column* using the *Condition* you specify.
{% hint style="info" %}
If a target query returns multiple records, the application Alerts only see the first one. As you change the Value Column setting, the current value of that field in the top row is shown beneath it.
{% endhint %}
Next, adjust how many notifications to receive while your alert is triggered. There are three options:
* **Just Once until back to normal:** means a notification will fire any time the alert status changes from `OK` to `TRIGGERED`.
* **Each time alert is evaluated until back to normal:** means a notification will fire whenever the alert status is `TRIGGERED` regardless of its status as of the previous evaluation.
* **Each time alert is evaluated for each row in the result**: This means a notification will fire for every individual row in the alert evaluation result that meets the criteria for being TRIGGERED. Regardless of the status of other rows or the previous evaluation of the same row, a unique notification will be generated for each row that is currently in a TRIGGERED state. This choice allows for granular notifications based on each specific row, ensuring that no triggering row goes unnoticed.
* **At most every ... when alert is evaluated:** lets you set a minimum interval between notifications. It splits the difference between *Just Once* and *Each time alert is evaluated*. This choice lets you avoid notification spam for alerts that trigger often.
Regardless of which notification setting you pick here, you will receive a notification whenever the status goes from `OK` to `TRIGGERED` or from `TRIGGERED` to `OK`. The schedule settings above only impact how many notifications you will receive if the status remains `TRIGGERED` from one execution to the next.
Finally, pick a **Template**. The **default template** is a message with links to the Alert configuration screen and the Query screen.
Many users will want to include more specific information about the Alert. To do this you can [Customize The Alert Template](https://docs.inverse.watch/user-guide/alerts/customize-alert-template).
When you’re finished, click **Create Alert** and then choose an [Alert Destination](https://redash.io/help/user-guide/alerts/creating-new-alert-destination). If you skip this step you will not be notified when the alert is triggered.
#### i. Muting Alerts
You can temporarily mute an alert’s notifications without deleting the alert entirely. Just click the vertical ellipsis (`⋮`) menu and choose *Mute Notifications*.
To resume notifications again, click the vertical ellipsis menu and choose *Unmute Notifications*.
### 2. Alert Statuses
* `TRIGGERED` means that on the most recent execution, the *Value Column* in your target query met the *Condition* and *Threshhold* you configured. If your alert checks whether “cats” is above 1500, your alert will be triggered as long as “cats” is above 1500.
* `OK` means that on the most recent query execution, the *Value Column* did not meet the *Condition* and *Threshhold* you configured. This doesn’t mean that the Alert was not triggered previously. If your “cats” value is now 1470 your alert will show as OK.
* `UNKNOWN` means the application does not have enough data to evaluate the alert criteria. You will see this status immediately after creating your Alert until the query has executed. You will also see this status if there was no data in the query result or if the most recent query result doesn’t include the *Value Column* you configured
### 3. Notification Frequency
The application sends notifications to your chosen Alert Destinations whenever it detects that the Alert status has changed from `OK` to `TRIGGERED` or vice versa. Consider this example where an Alert is configured on a query that is scheduled to run once daily. The daily status of the Alert appears in the table below. Prior to Monday the alert status was `OK`.
| Day | Alert Status |
| --------- | ------------ |
| Monday | OK |
| Tuesday | OK |
| Wednesday | TRIGGERED |
| Thursday | TRIGGERED |
| Friday | TRIGGERED |
| Saturday | TRIGGERED |
| Sunday | OK |
If the notification frequency is set to *Just Once*, the application would send a notification on Wednesday when the status changed from `OK` to `TRIGGERED` and again on Sunday when it switches back. It will not send alerts on Thursday, Friday, or Saturday unless you specifically configure it to do so because the Alert status did not change between executions on those days.
---
# Agent Instructions
This documentation is published with GitBook. GitBook is the documentation platform designed so that both humans and AI agents can read, navigate, and reason over technical content effectively. Learn more at gitbook.com.
## Querying This Documentation
If you need additional information that is not directly available in this page, you can query the documentation dynamically by asking a question.
Perform an HTTP GET request on the current page URL with the `ask` query parameter, and the optional `goal` query parameter:
```
GET https://docs.inverse.watch/user-guide/alerts/setting-up-an-alert.md?ask=&goal=
```
`ask` is the immediate question: it should be specific, self-contained, and written in natural language.
`goal` is optional and describes the broader end goal you are ultimately trying to accomplish on behalf of the user. GitBook uses it to tailor the answer towards what is most useful for that goal.
The response will contain a direct answer to the question and relevant excerpts and sources from the documentation.
Use this mechanism when the answer is not explicitly present in the current page, you need clarification or additional context, or you want to retrieve related documentation sections.