> For the complete documentation index, see [llms.txt](https://docs.inverse.watch/llms.txt). Markdown versions of documentation pages are available by appending `.md` to page URLs; this page is available as [Markdown](https://docs.inverse.watch/user-guide/dashboards/creating-and-editing-dashboards.md).
# Creating and Editing Dashboards
### 1. Creating a Dashboard
A dashboard lets you combine visualizations and text boxes that provide context with your data.
You can create a new dashboard by clicking the **New Dashboard** button from the Dashboard section.
After naming your dashboard, you can add widgets from existing query visualizations or by writing commentary with a text box. Start by clicking the **Add Widget** button. Search existing queries or pick a recent one from the pre-populated list.
You can also add a Textbox by clicking the **Add Textbox** button. The Textbox supports basic [Markdown](https://www.markdownguide.org/cheat-sheet/#basic-syntax). In the example below, a link to the Inverse Watch Website has been added (read more about the Textbox further below).
creating a dashboard
#### i. Dashboard URLs
When you create a dashboard, the application automatically assigns it an `id` number and a URL `slug`. The slug is based on the name of the dashboard. For example a dashboard named “Example” could have this URL:
`https://app.inverse.watch/dashboards/23-example`
If you change the dashboard name to “Account Over (Old)”, the URL will update to:
`https://app.inverse.watch/dashboards/23-account-over-old-`
The dashboard can also be reached using its ID:
* `https://app.inverse.watch/dashboards/23`
The dashboard can also be reached using a slug. Example:
* `https://app.inverse.watch/dashboards/20-transfer_dola/account-overview`
Dashboard ids are guaranteed to be unique. But multiple dashboards may use the same name (and therefore `slug`). If a user visits `/dashboard/account-overview` and more than one dashboard exists with that slug, they will be redirected to the earliest created dashboard with that slug.
### 2. Picking Visualizations
By default, query results are shown in a table. At the moment it’s not possible to create a new visualization from the “Add Widget” menu, so you’ll need to open the query and add the visualization there beforehand ([instructions](https://docs.inverse.watch/user-guide/visualizations/visualizations-how-to)).
### 3. Adding Text Boxes
Add a text box to your dashboard using the `Text Box` tab on the **Add Widget** dialog. You can style the text boxes in your dashboards using [Markdown](https://daringfireball.net/projects/markdown/syntax).
{% hint style="info" %}
You can include static images on your dashboards within your markdown-formatted text boxes. Just use markdown image syntax:``
{% endhint %}
### 4. Dashboard Filters
When queries have filters you need to apply filters at the dashboard level as well. Setting your dashboard filters flag will cause the filter to be applied to all Queries.
1\. Open dashboard settings:
2\. Check the “Use Dashboard Level Filters” checkbox:
### 5. Managing Dashboard Permissions
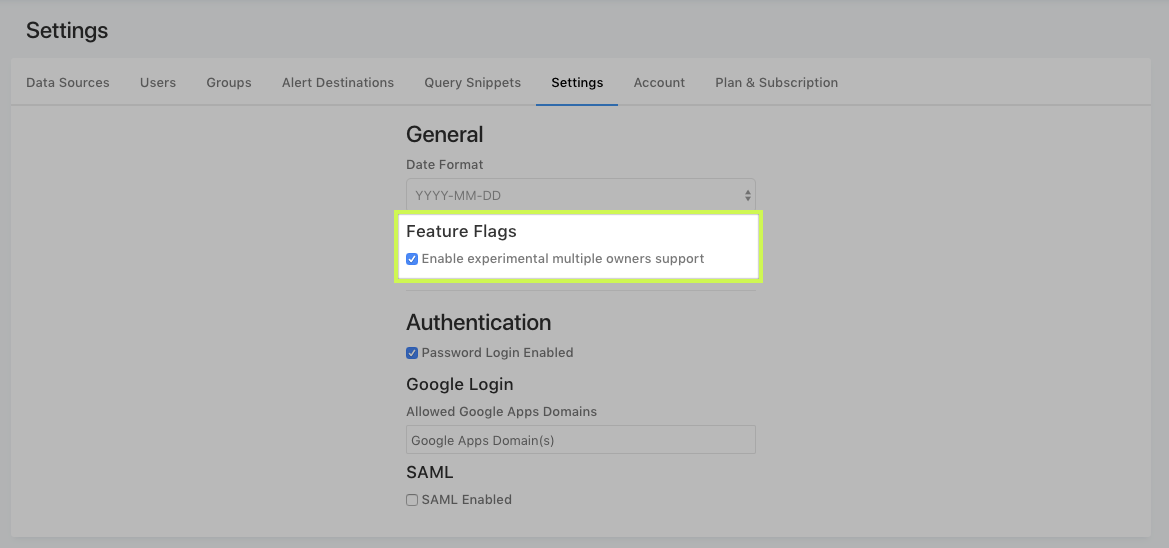
By default, dashboards can only be modified by the user who created them and members of the Admin group. But the application includes experimental support to share edit permissions with non-Admin users. An Admin in your organization needs to enable it first. Open your organization settings and check the “Enable experimental multiple owners support”
Now the Dashboard options menu includes a `Manage Permissions` option. Clicking on it it will open a dialog where you can add other users as editors to your dashboard.
Please note that currently the users you add won’t receive a notification, so you will need to notify them manually.
### 6. Dashboard Refresh
Even large dashboards should load quickly because they fetch their data from a cache that renews whenever a query runs. But if you haven’t run the queries recently, your dashboard might be stale. It could even mix old data with new if some queries ran more recently than others.
To force a refresh, click the Refresh button on the upper-right of the dashboard editor. This runs all the dashboard queries and updates its visualizations.
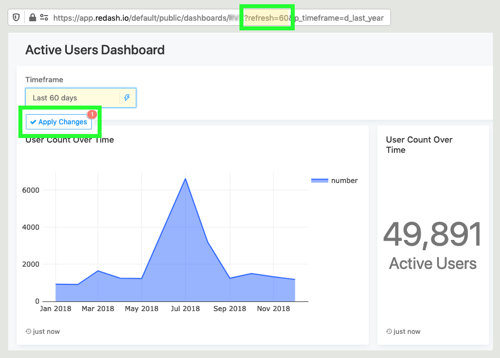
If you want this to happen periodically you can activate Automatic Dashboard Refresh from the UI by clicking the dropdown pictured below. Or you can pass a `refresh` query string variable with your dashboard URL. **The allowed refresh intervals are expressed in seconds**: 60, 300, 600, 1800, 3600, 43200, and 86400.
dashboard refresh
Automatic Dashboard Refresh occurs as part of the the application frontend application. Your refresh schedule is only in-effect as long as a logged-in user has the dashboard open in their browser. To guarantee that your queries are executed regularly (which is important for alerts), you should use a [Scheduled Query](https://redash.io/help/user-guide/querying/scheduling-a-query) instead.
On public dashboards there is no Refresh button. You can add `refresh` to the query string. And for dashboards with parameters you can trigger a refresh by changing a parameter value and clicking **Apply Changes**.
---
# Agent Instructions
This documentation is published with GitBook. GitBook is the documentation platform designed so that both humans and AI agents can read, navigate, and reason over technical content effectively. Learn more at gitbook.com.
## Querying This Documentation
If you need additional information that is not directly available in this page, you can query the documentation dynamically by asking a question.
Perform an HTTP GET request on the current page URL with the `ask` query parameter, and the optional `goal` query parameter:
```
GET https://docs.inverse.watch/user-guide/dashboards/creating-and-editing-dashboards.md?ask=&goal=
```
`ask` is the immediate question: it should be specific, self-contained, and written in natural language.
`goal` is optional and describes the broader end goal you are ultimately trying to accomplish on behalf of the user. GitBook uses it to tailor the answer towards what is most useful for that goal.
The response will contain a direct answer to the question and relevant excerpts and sources from the documentation.
Use this mechanism when the answer is not explicitly present in the current page, you need clarification or additional context, or you want to retrieve related documentation sections.