> For the complete documentation index, see [llms.txt](https://docs.inverse.watch/llms.txt). Markdown versions of documentation pages are available by appending `.md` to page URLs; this page is available as [Markdown](https://docs.inverse.watch/user-guide/queries/how-to-schedule-a-query.md).
# How to Schedule a Query
You can use scheduled query executions to keep your dashboards updated or to power routine Alerts. By default, your queries will not have a schedule. But this is easy to adjust. In the bottom left corner of the query editor you’ll see the schedule area.
Clicking **Never** will open a picker with allowed schedule intervals.
schedule a query
Your query will run automatically once a schedule is set.
When you schedule queries to run at a certain time-of-day, the application converts your selection to UTC using your computer’s local timezone. That means if you want a query to run at a certain time in UTC, you need to adjust the picker by your local offset.
For example, if you want a query to execute at `00:00` UTC each day but your current timezone is CDT (UTC-5), you should enter `19:00` into the scheduler. The UTC value is displayed to the right of your selection to help confirm your math.
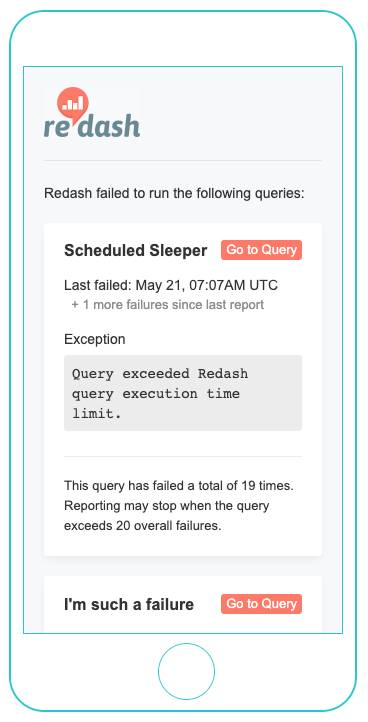
### Scheduled Query Failure Reports
The application has the ability to email query owners once per hour if one or more queries failed. These emails continue until there are no more failures. Failure report emails run on an independent process from the actual query schedules. It may take up to an hour after a failed query execution before the application sends the failure report.
You can toggle failure reports from your organizations settings. Under **Feature Flags** check **Email query owners when scheduled queries fail**.
---
# Agent Instructions
This documentation is published with GitBook. GitBook is the documentation platform designed so that both humans and AI agents can read, navigate, and reason over technical content effectively. Learn more at gitbook.com.
## Querying This Documentation
If you need additional information that is not directly available in this page, you can query the documentation dynamically by asking a question.
Perform an HTTP GET request on the current page URL with the `ask` query parameter, and the optional `goal` query parameter:
```
GET https://docs.inverse.watch/user-guide/queries/how-to-schedule-a-query.md?ask=&goal=
```
`ask` is the immediate question: it should be specific, self-contained, and written in natural language.
`goal` is optional and describes the broader end goal you are ultimately trying to accomplish on behalf of the user. GitBook uses it to tailor the answer towards what is most useful for that goal.
The response will contain a direct answer to the question and relevant excerpts and sources from the documentation.
Use this mechanism when the answer is not explicitly present in the current page, you need clarification or additional context, or you want to retrieve related documentation sections.